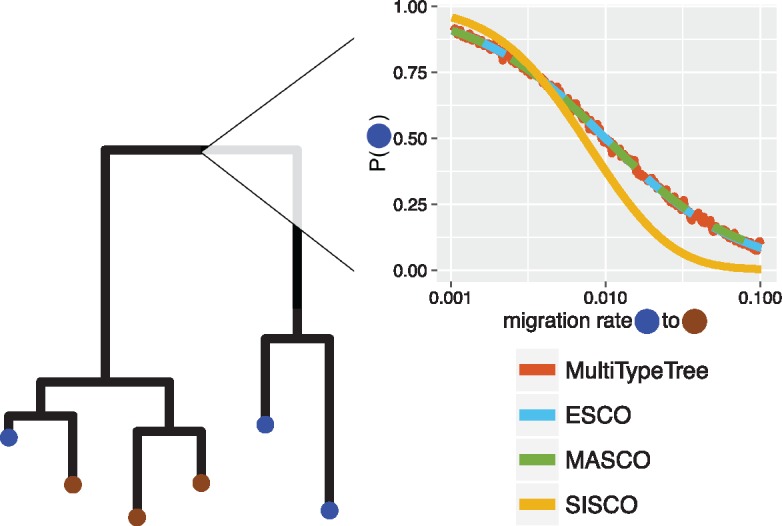
Fig. 2.

Inferred location of the root for different migration rates and structured coalescent approaches. The plot shows the probability of the root being in the blue state (y-axis) depending on the migration rate from blue to brown (x-axis), for the given tree and sampling states. The migration rate from brown to blue was held constant at 0.01. The height of the tree was ∼42 arbitrary units of time and the coalescent rates were 2 (in blue) and 4 (in red).
