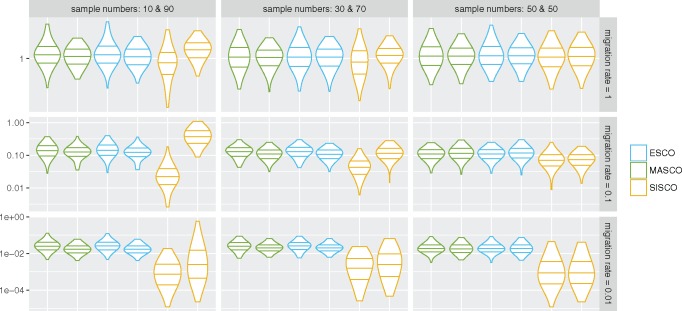
Fig. 5.
Inferred migration rates under different sampling conditions. The plot shows the distribution of mean inferred migration rates using ESCO, MASCO, and SISCO. From the left, the first distribution of a color (indicating the different methods) always shows the distribution of mean inferred migration rates from state 1 to state 2. The second distribution from the same color shows the rates from state 2 to 1. From left to right the number of samples from state 1 and state 2 are changed, whereas from top to bottom the true symmetric migration rates are going from 1 to 0.01. The lines within the violin plots indicate the first, second, and third quantiles. The coalescent rates were 2 in both states and the migration rates ranged from 0.01 to 1. The migration rates were always symmetric, that is, the same in both directions. The leaves were sampled uniformly between t = 0 and t = 25. Each simulation was repeated 100 times and each inference was run with 3 parallel MCMC chains, each with different initial values. An exponential prior distribution with the mean was used on the migration and coalescent rates.

