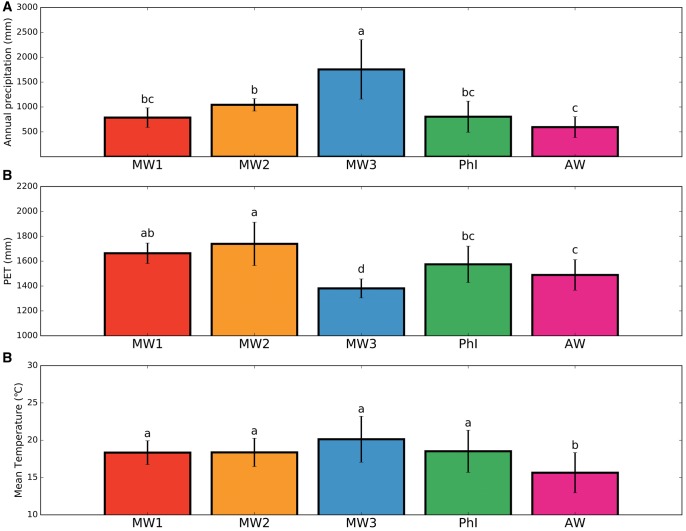
Fig. 5.
Climatic distribution of the different genetic groups identified by population clustering analysis. (A) Annual precipitation, (B) PET, and (C) Annual mean temperature. Only genotypes with a membership coefficient (Q) ≥ 0.7 were considered. The genetic groups are colored as in figure 2. Histograms represent the group mean, whereas error bars are the group standard deviation. Different letters were assigned based on Tukey–HSD multiple comparison post hoc test. MW, Mesoamerican wild; AW, Andean Wild; PhI, Northern Peru–Ecuador.

