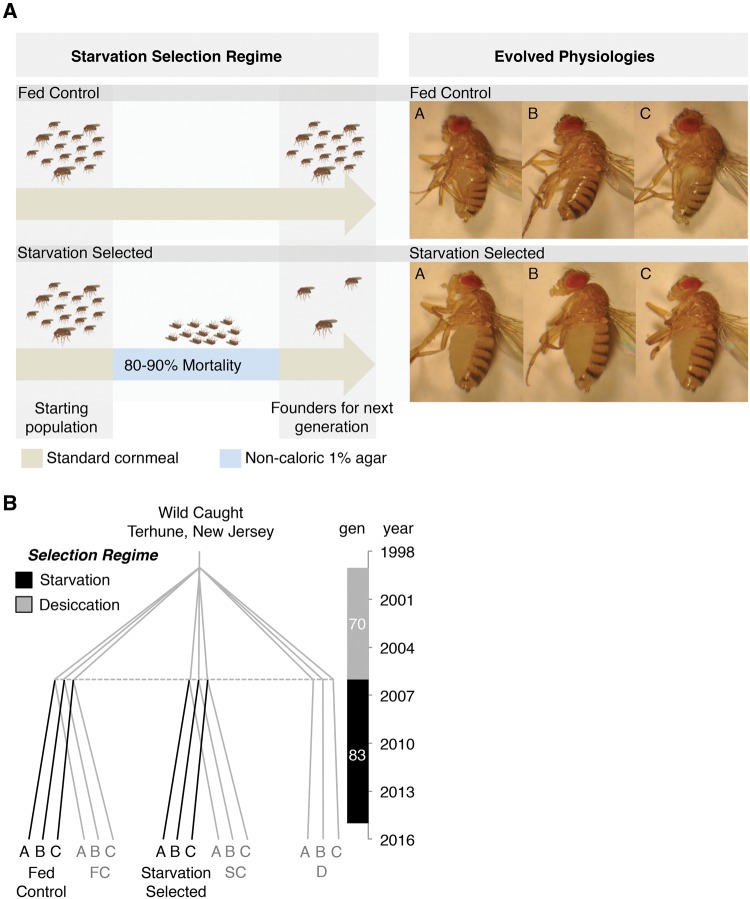
Fig. 1.
Selection regime, phylogeny and evolutionary history of the selected populations. (A) Each generation the starvation-selected populations SA–C were starved until 80–90% had died. The survivors were used as founders for the subsequent generation. At the same time the fed control populations FA–C were handled in parallel and fed ad libitum. The visible differences between FA–C and SA–C as 4–5-day-old adults demonstrate some of the evolved characteristics. (B) Detailed phylogeny and evolutionary history of the starvation-selected lines. Axis to the right displays the number of generations and year. Black lines represent the starvation-selection experiment studied here. To date, the starvation-selection experiment has been running for over 100 generations; however, sequence data were collected at generation 83.

