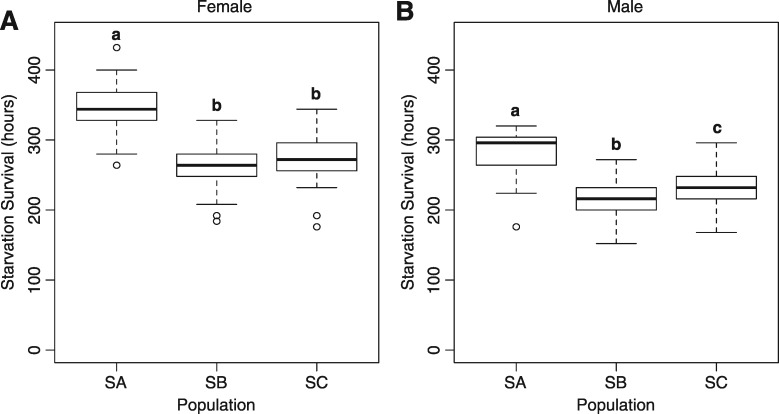
Fig. 3.
Differences in starvation resistance between the starvation-selected populations match patterns of genetic heterogeneity. The SA population is significantly better at surviving starvation than the SB and SC populations for both (A) females and (B) males. Different letters signify statistically different groups where P < 0.05; Tukey Post hoc; ANOVA; N = 47–50.

