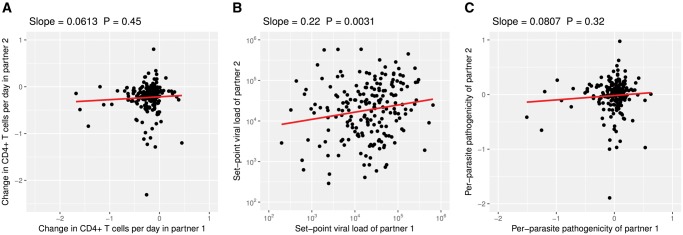
Fig. 2.
Heritability estimates from donor–recipient regressions. For these regressions we plotted the trait values for each partner (“partner 1” and “partner 2”) in the transmission pairs onto the x- and y-axes. Since we do not know the direction of the transmission in the pairs, the assignment of the partners to either x- or y-axis is random. (See also supplementary fig. S2, Supplementary Material online.)

