
Fig. 3.
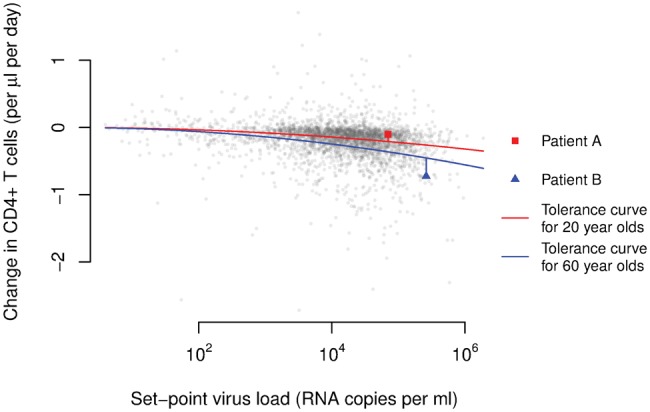
As a surrogate for the per-parasite pathogenicity we use the residuals from age-adjusted tolerance curves. In the graph, we plotted each individual’s CD4+ T-cell decline versus his/her set-point viral load. The red and blue curves show the average relationships between these two measures in the groups that were 20 and 60-years-old at the time of their infection, respectively. These age-adjusted tolerance curves were determined previously (Regoes et al. 2014). The red square and blue triangle highlight two individuals with an age at infection of 20 and 60 years, respectively.