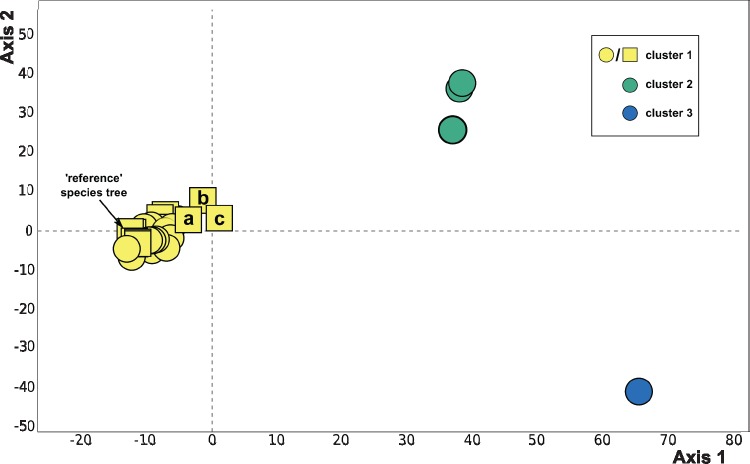
Fig. 1.
Clustering of species trees based on Robinson–Foulds symmetric distance for all data treatments (see table 1) using ASTRAL and ASTRAL-MLBS (circles) or IQ-TREE analysis of a concatenated matrix (squares). Most species trees fall within cluster 1, including the tree shown in figure 2. Cluster 1 also includes concatenation-based species trees with 10–20% taxon occupancy at alignment column occupancy cutoffs of 0.8 (a), 0.5 (b), and 0.2 (c). Outlying clusters 2 and 3 represent ASTRAL and ASTRAL-mlbs species trees for 10–20% taxon occupancy partitions and alignment column occupancy cutoffs of 0.2 and 0.5 (cluster 2; four trees total, two are topologically identical) and 0.8 (cluster 3; two topologically identical trees).

