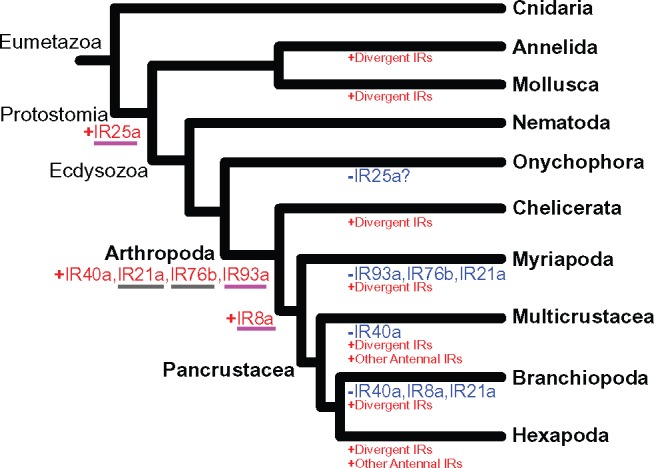
Fig. 4.

IR gene gains and losses in the Metazoa. IR gene subfamily gains (red color) and losses (blue color) are shown along the branches. The taxa used for this analysis are listed in the Results section (in the section “Origins of Ionotropic Receptors Subfamilies”). The antennal IR genes that show significant differential expression between the sexes in the copepod Eurytemora affinis are underlined in magenta, whereas the IR genes that do not show significant differences are underlined in gray (see fig. 5 and supplementary table S8, Supplementary Material online).
