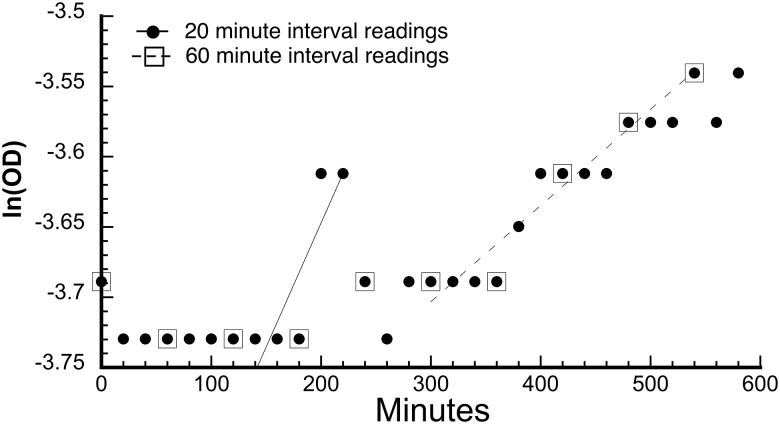
Fig. 1.
Illustration of effects of O.D. readings at 20 versus 60-min intervals. This example is from a 2017 experiment in which genotype 1110 grew in the presence of 0.1 µg/ml ceftriaxone. See supplementary data 2017, Supplementary Material online, sheet CRO 0.1 rr1, cell L9 for the 60-min interval growth rate. Filled circles: Readings at 20-min intervals. Open squares: Subset of readings at 60-min intervals. Solid line: Line of best fit to the five consecutive 20-min interval points that give the highest growth rate. Growth rate = 0.00177 min−1, and R = 0.866. Dashed line: Line of best fit to the five consecutive 60-min interval points that give the highest growth rate. Growth rate = 0.00068 min−1, and R = 0.971.

