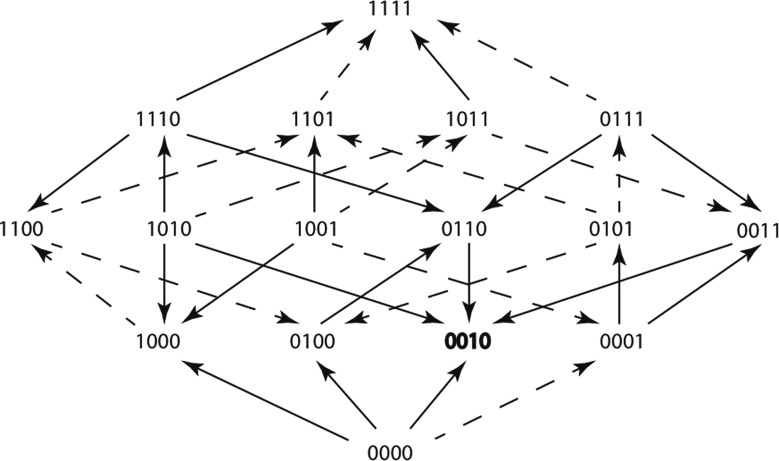
Fig. 4.
An adaptive landscape estimated from the growth rate means of 16 variant genotypes within TEM-85. The adaptive landscape was created using the treatment Cefotetan at the sublethal concentration of 0.063 µg/ml. Arrows point in the direction of the faster growing genotype, solid arrows represent significant differences between growth rates (using one-way ANOVA P value < 0.05), dashed arrows represent insignificant differences between growth rates (using one-way ANOVA P value > 0.05). The genotype that grew the fastest of all 16 genotypes is shown in bold font.

