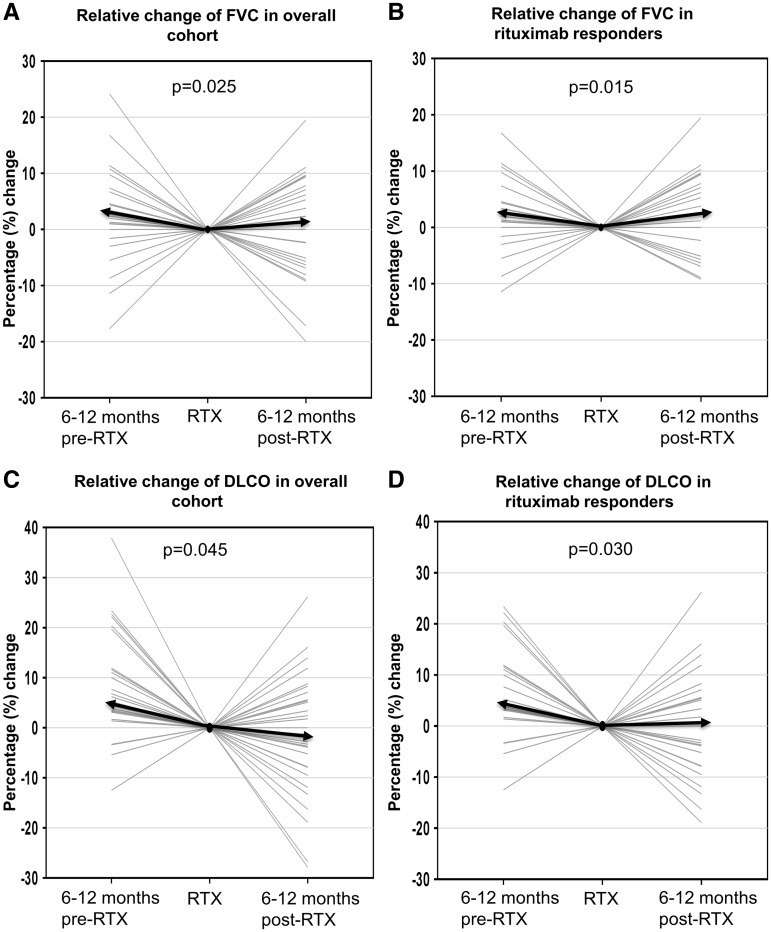
Fig. 1.
Pre- and post-treatment lung function trends
(A) Overall, the median relative change of FVC was −2.4% (IQR −7.1–+0.8) pre-RTX as compared with +1.2% (IQR −6–+8.6) post-RTX, representing a difference of + 4.2% (P = 0.025). (B) For RTX responders (improvement or stable PFT), the median difference in the change of FVC between pre-RTX vs post-RTX was +5.1% (P = 0.015). (C) Overall, the median change of DLCO was −4.4% (IQR −11.8 to − 3.2) pre-RTX compared with −1.3% (IQR −8.7 s.d.+6.4) post-RTX, representing a difference of + 3.7% (P = 0.045). (D) For RTX responders, the median difference in the change of DLCO between pre-RTX vs post-RTX was +4.4% (P = 0.030). The median change for each graph is represented by the solid black arrow.

