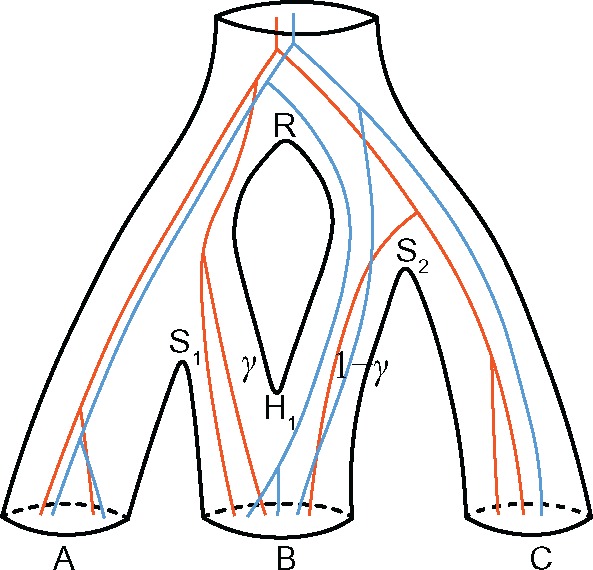
Fig. 2.

Two gene trees embedded in the species network of figure 1a. There are two samples from species A, three samples from B, and either one or two samples from C. For each gene tree lineage traversing the reticulation node H1 backward in time, it goes to the left population with probability γ, and to the right with probability .
