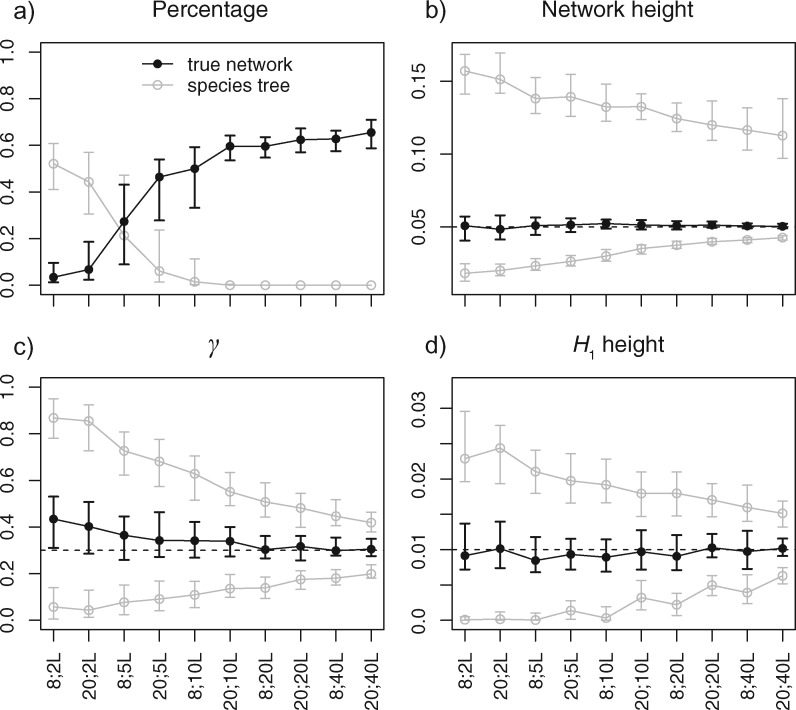
Fig. 5.
Posterior estimates of (a) probability of the true network (black) and species trees (gray), (b) network height, (c) γ in the true network topology, and (d) H1 height in the true network topology, when the data were simulated under the network in figure 1a with sample configuration (2, 4, 2) or (5, 10, 5), and 2, 5, 10, 20, or 40 loci, respectively. For each setting in (a), the dot/circle with error bars are the median and the first and third quartiles of the percentages of 100 replicates. For each setting in (b), (c), and (d), the black dot with error bars are the median and the first and third quartiles of the posterior medians of 100 replicates, the gray circles with error bars are the same summaries for the 95% HPD intervals. The dashed lines indicate the true values.

