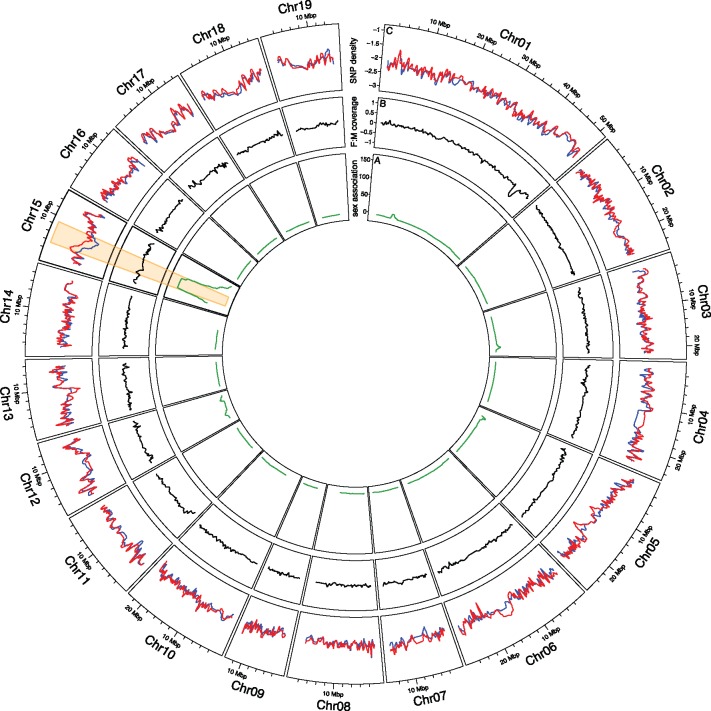
Fig. 2.
Genome-wide analysis of patterns of sequence divergence. The innermost circle (A) displays the association (as Bonferroni corrected P-values of a Fisher’s exact test) of genetic SNP markers with the sex of the individual based on a bi-parental population of 271 offspring individuals (Pucholt et al. 2017). The second circle (B) displays the relative Log2 female:male genome coverage, whereas the outermost circle (C) displays the Log2 absolute female (red) and male (blue) SNP density. The region on chromosome 15 with genetic markers strongly associated with phenotypic sex is highlighted throughout all circles. The lines represent a moving average over a window size of 25 scaffolds/markers.

