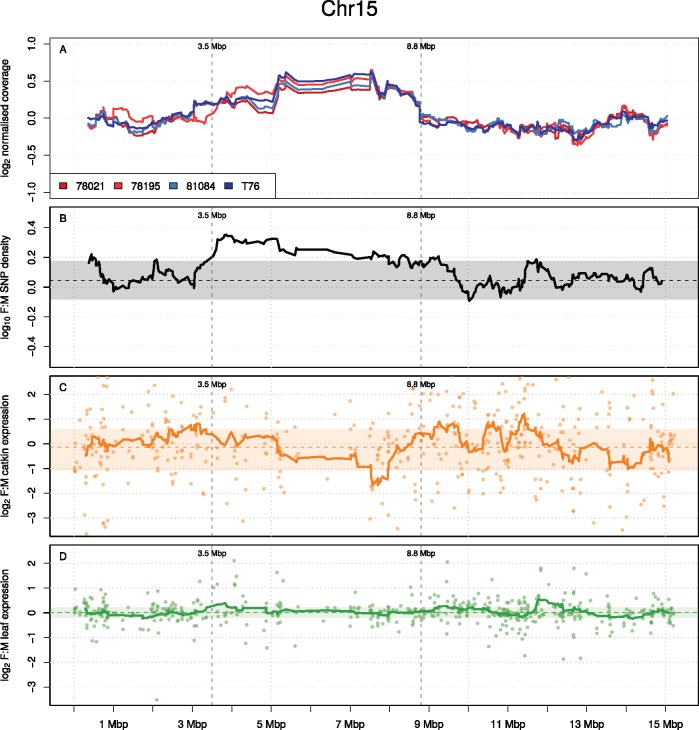
Fig. 3.
Patterns of sex chromosome differentiation on chromosome 15. (A) Log2 normalized per base coverage of all individuals that were used in the study (red: females, blue: males). (B) Log10 female:male SNP density. (C) Log2 female:male FPKM expression values in catkins. (D) Log2 female:male FPKM expression values in leaves. Shaded areas represent the bootstrap based 95% confidence interval, horizontal dashed lines represent the bootstrap median value whereas solid lines represent a moving average over a window size of 25 scaffolds/genes for the metrics in question. Grey vertical dashed lines represent the border of the SD region as defined by the SNP analysis.

