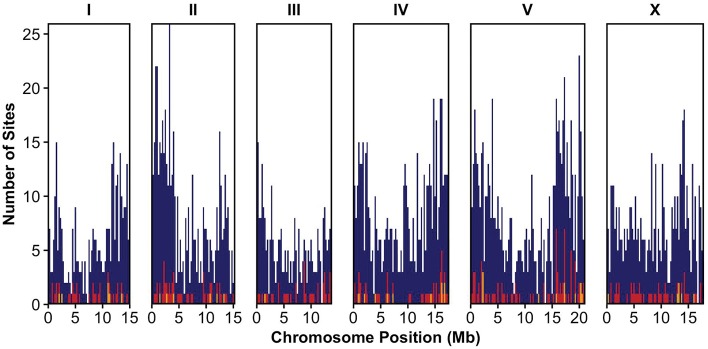
Fig. 1.
Distribution of transposon sites along the six C. elegans chromosomes. Counts represent the number of non-redundant transposon positions from all strains. DNA transposons are displayed in dark blue, retrotransposons in red, and transposons of unknown classification in yellow. Each bin represents 0.25 Mb. The x-axis ticks mark every 5 Mb.

