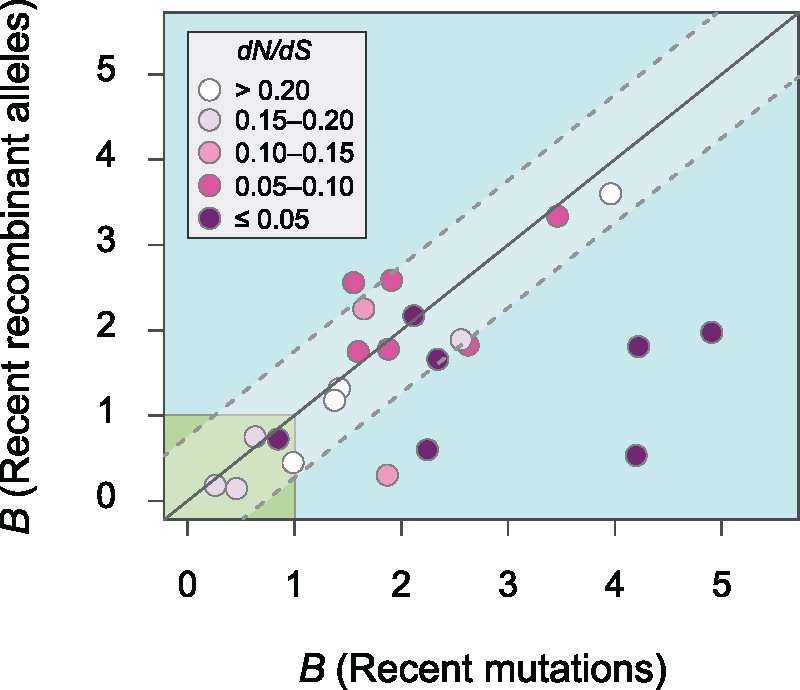
Fig. 6.

Nucleotide bias of recent recombinant alleles and recent mutations. The metric B represents the number of changes from G or C to A or T relative to the number of changes from A or T to G or C at 4-fold degenerate sites. On each axis, a value of B < 1 indicates an enrichment toward G and C (lower left corner), and value of B > 1 indicates an enrichment toward A and T. The solid diagonal line indicates identical nucleotide bias for recent recombinant alleles and recent mutations; the dotted lines represent half of the standard deviation. Values were normalized by the GC-contents at 4-fold degenerate sites for each species prior to calculating overall proportions, and species with fewer than 50 polymorphic sites for a given category of alleles were excluded. As indicated in the key, the color shading of dots denotes the dN/dS ratio of recombinant alleles for a species. All phylogenetic trees of species included in this analysis display average bootstrap values >70, and the list of included species and the corresponding average bootstrap values are indicated in bold in supplementary table S1, Supplementary Material online.
