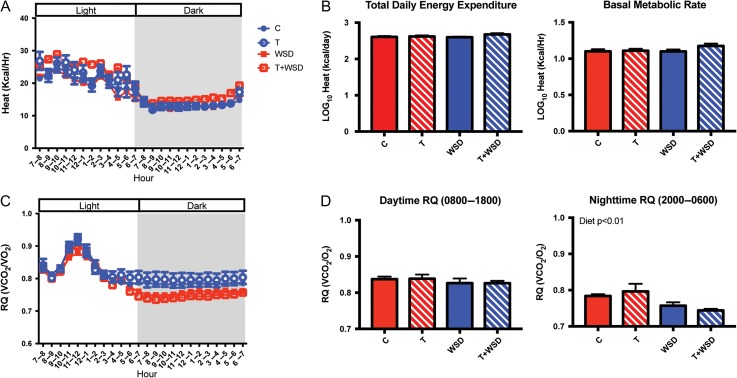
Figure 5.
Indirect calorimetry at 36 months of treatment. Hourly averages of heat (kcal/h) are shown for a 24-h sampling period (A) in control (C), testosterone (T), WSD and T + WSD groups. Total daily energy expenditure was calculated as the sum of hourly averages of heat (kcal/h). BMR was the average of heat values between 01:00-05:00 am when animals are asleep (B). Both measures were log transformed to correct for normality. The hourly RQ is shown for the same 24-h sampling period (C) and average RQ for day and nighttime were analyzed (D). Values are the mean ± SEM with n = 10/group. Mann–Whitney significance finding for the nighttime RQ is presented as text within the graph. RQ, respiratory quotient.

