Fig. 4.

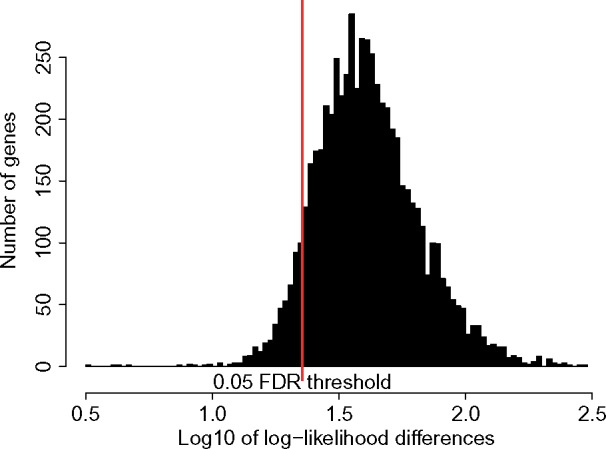
Log10 of the differences in log-likelihoods between stationary and nonstationary models on mammalian data. The red line stands for the 5% FDR threshold.

Log10 of the differences in log-likelihoods between stationary and nonstationary models on mammalian data. The red line stands for the 5% FDR threshold.