Fig. 6.

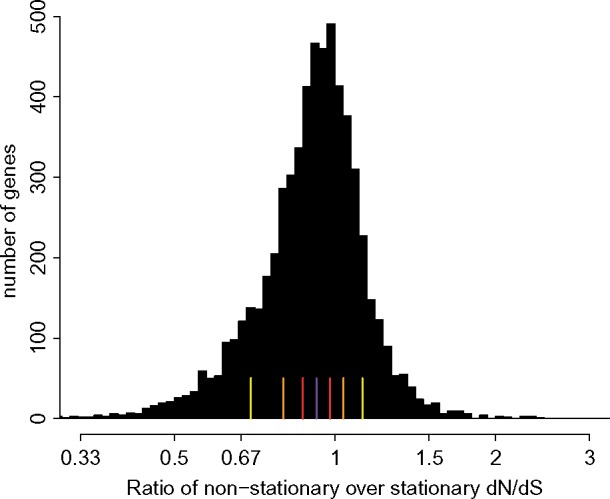
Histogram of the ratios in estimates of ω in stationary model over nonstationary model on mammalian data. Yellow, orange, and red lines stand for 12.5%, 25%, and 37.5% quantiles. The purple line represents the median.

Histogram of the ratios in estimates of ω in stationary model over nonstationary model on mammalian data. Yellow, orange, and red lines stand for 12.5%, 25%, and 37.5% quantiles. The purple line represents the median.