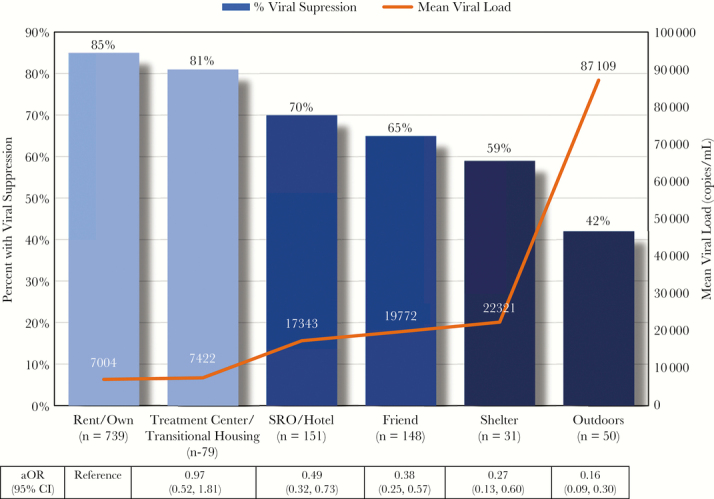
Figure 1.

Percent of Patients with Viral Suppression and Mean Viral Load by Living Arrangement among PLHIV at Ward 86 (N=1222). n=total number of patients within each category of housing status. N=total number of patients evaluated. aOR = Adjusted Odds Ratio of Viral Suppression. CI = 95% confidence interval.
