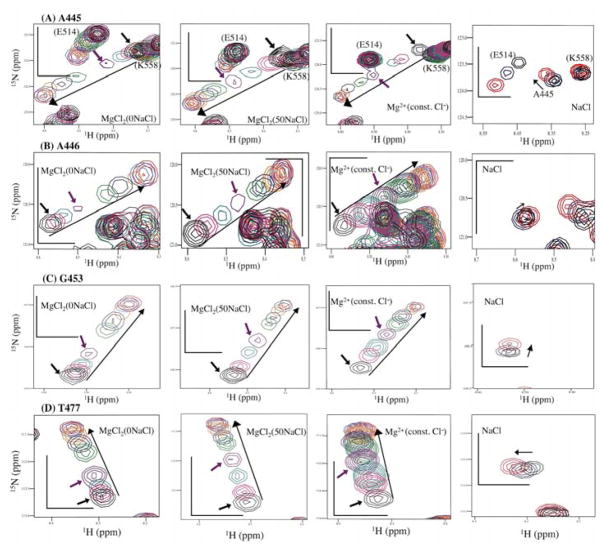
Figure 7.
Changes in chemical shifts in 1H-15N HSQC spectra upon Mg2+ titration and NaCl titration for RNH residues in the β-sheet region, (A) A445, (B) A446, (C) G453, and (D) T477. Four panels are shown for each residue: from left to right, MgCl2(0NaCl), MgCl2(50NaCl), Mg2+(const. Cl−), and NaCl. Overlay of 1H-15N HSQC signals were made for MgCl2(0NaCl), MgCl2(50NaCl), and Mg2+(const. Cl−) titrations at 0 mM (black), 2 mM (pink), 5 mM (teal), 10 mM (purple), 20 mM (green), 30 mM (navy), 50 mM (orange), 70 mM (skyblue), and 80 mM (red) Mg2+ concentrations. Overlays of 1H-15N HSQC signals were made for NaCl titration at 0 (black), 50 mM (blue), and 160 mM (red). Arrows show the direction of chemical shift perturbation. Scales on each plot (black bars) represent 1 ppm for 15N and 0.1 ppm for 1H dimension.

