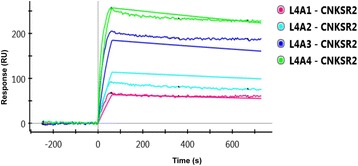
Fig. 6.

Curve fitting of Smurf2-CNKSR2 interaction responses using Langmuir model. Sensorgrams obtained from injections of CNKSR2 at concentrations of 0.25, 0.5, 1.0 and 2.0 μM over Smurf2 captured on the GLC chip surface. The curves depict the grouped fit of the data to a simple 1:1 bimolecular interaction model, yielding ka = 1.52E + 04 M− 1 s− 1, kd = 2.11E-04 s− 1 and KD = 1.39E-08 M
