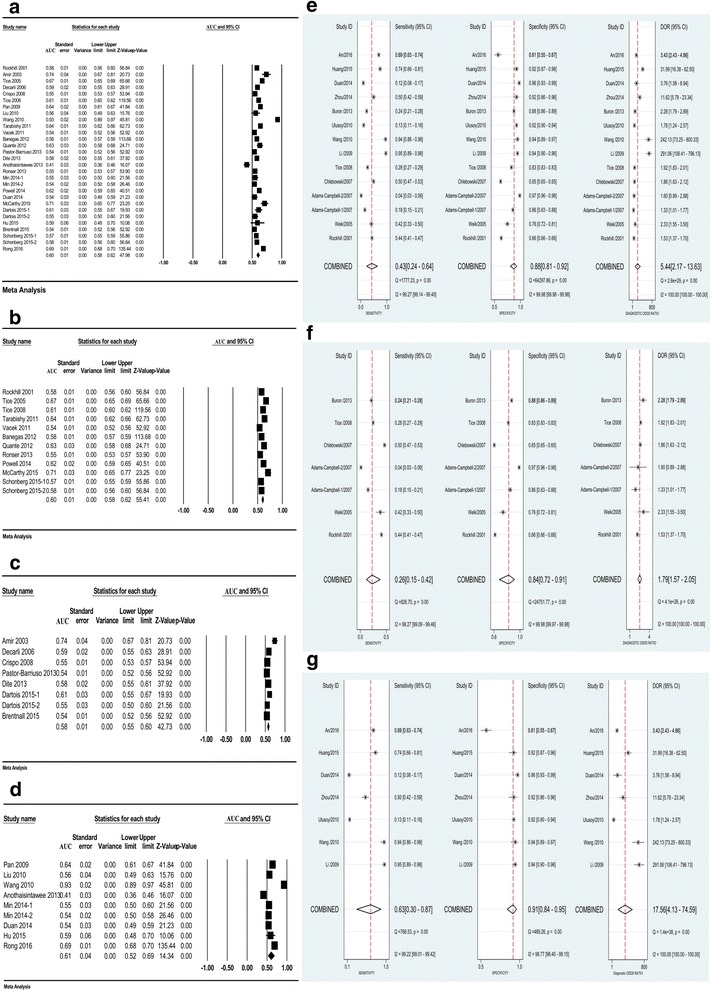
Fig. 3.

Pooled discrimination and diagnostic accuracy of the Gail model in total or stratified by geographic region. Pooled AUC/C-statistic of the Gail model in total (a) and studies from America (b), Europe (c) and Asia (d), respectively. Pooled sensitivity, specificity and diagnostic odds ratio (DOR) of the Gail model in total (e) and studies from America and Europe (f) and Asia (g), respectively. AUC area under the curve, CI confidence interval
