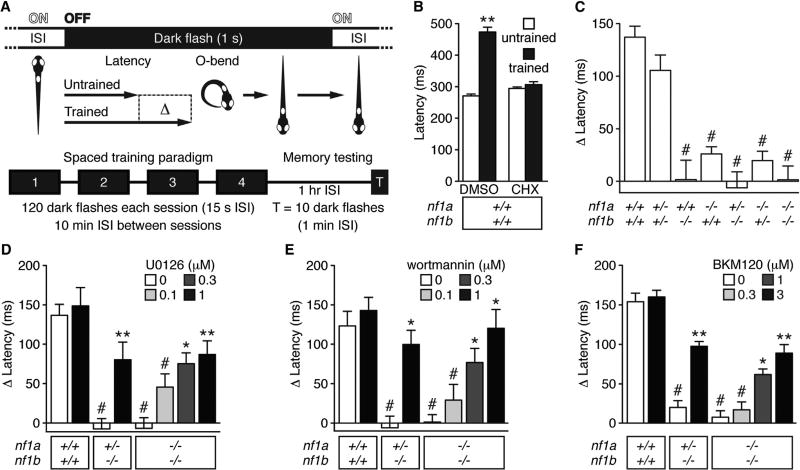
Figure 1. nf1 Mutant Larvae Exhibit Reduced Memory Recall.
(A) Schematic representation of the visual memory assay. ISI, interstimulus interval.
(B–F) Mean O-bend latency (B) or latency change (C–F) 1 hr after spaced training (test) versus untrained controls (n = 26–130 O-bend maneuvers per genotype/treatment). #p < 0.001 versus wild-type untreated (C) or DMSO-treated (B and D–F) larvae. *p < 0.01, **p < 0.001 versus same genotype, DMSO-treated larvae. One-way ANOVA. Error bars denote SEM.
See also Figures S2 and S3.

