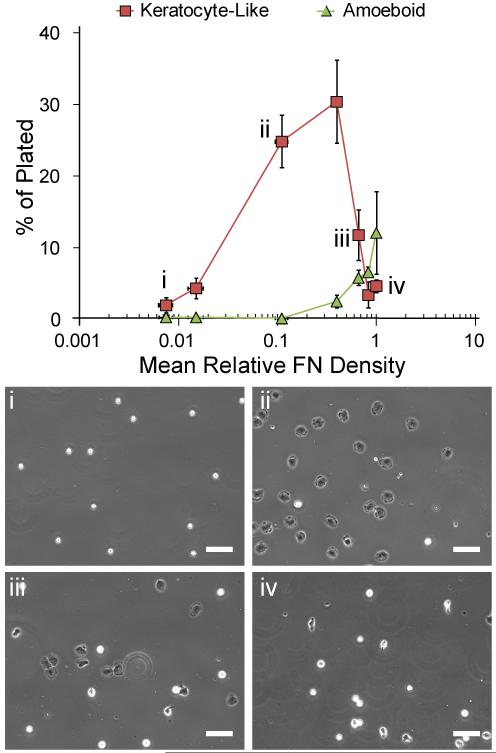
Fig. 2. Neutrophil phenotype on increasing densities of FN.
Adherent neutrophils as percentage of total plated cells per sub-saturating densities of FN. Representative images from a single experiment on (i) 0.7% (ii) 11% (iii) 66% and (iv) 100% saturated FN substrates. Scalebars are 50 μm. Error bars are ± standard error of the mean. Substrate density was measured via quantitative fluorescence microscopy (Supplementary Fig. 4b). All substrates were FN-printed and Pluronic-blocked PDMS.

