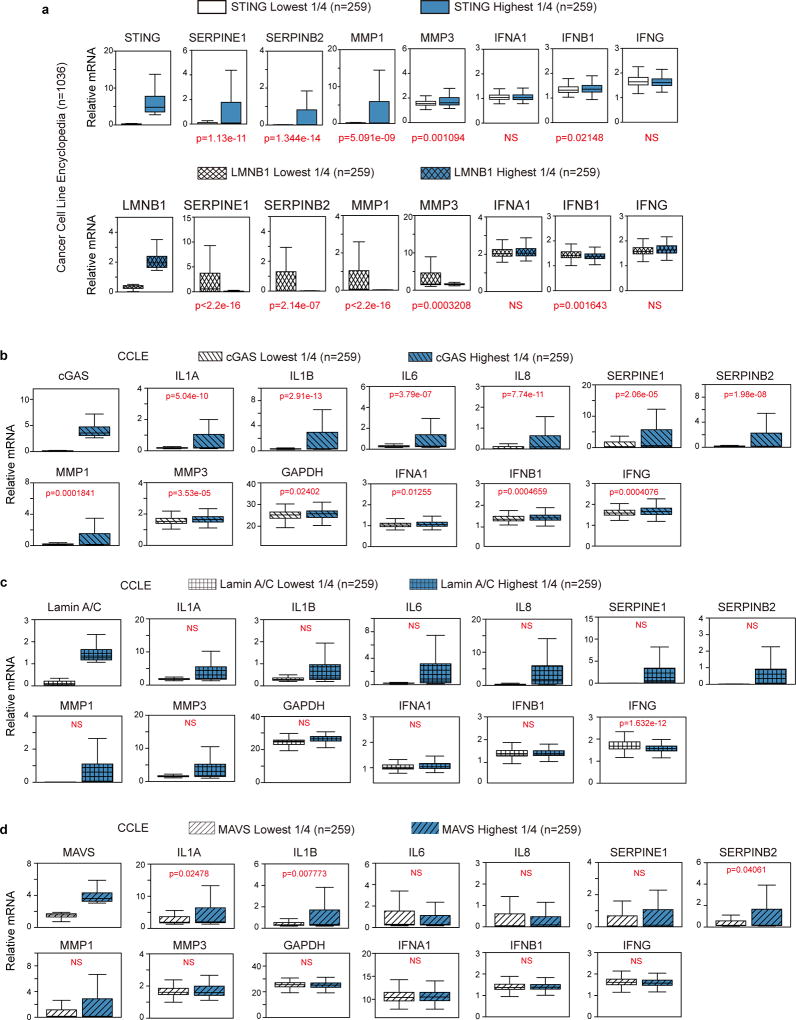
Extended Data Figure 9. CCLE analyses of pro-inflammatory gene expression.
a, Related to Fig. 4g, additional genes associated with STING or Lamin B1. b, Analyses of cGAS with pro-inflammatory gene expression profiles. Samples with the highest 25% and the lowest 25% of cGAS expression were selected, grouped, and the numbers of samples are indicated. c, Lamin A/C does not show negative correlation with inflammatory genes. d, MAVS does not correlate with pro-inflammatory gene expression. Statistical significance is judged by one-sided Wilcoxon Rank Sum test. P values are shown for each comparison. NS: non-significant (p>0.05). See Methods for additional details.

