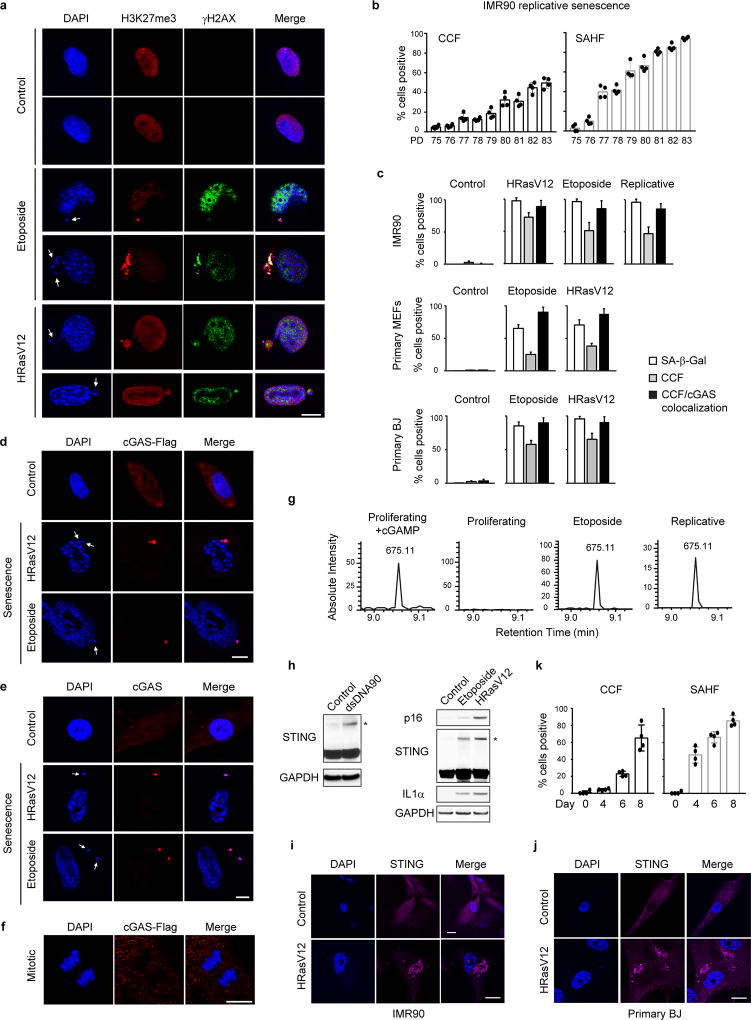
Extended Data Figure 1. CCF-cGAS-STING activation in senescence.
a, Confocal microscopy analyses of primary MEFs. CCF indicated by arrows. b, Quantification of IMR90 undergoing replicative senescence. PD: population doubling. c, Microscopy-based quantification of parameters as indicated. d–f, Confocal microscopy analyses of BJ (d), IMR90 stained for endogenous cGAS (e), and mitotic IMR90 (f). g, cGAMP detection by nano-LC-MS. MS2 spectra were confirmed for cGAMP. h, IMR90 were analyzed by immunoblotting. STING blots were performed under non-reducing condition. * indicates STING dimer. i–j, Confocal microscopy images of STING in IMR90 (i) and BJ (j). k, Cells as in Fig. 1c were quantified under microscopy. Bar graphs show mean values of four different fields with over 200 cells and s.d. Scale bars: 10 µm.

