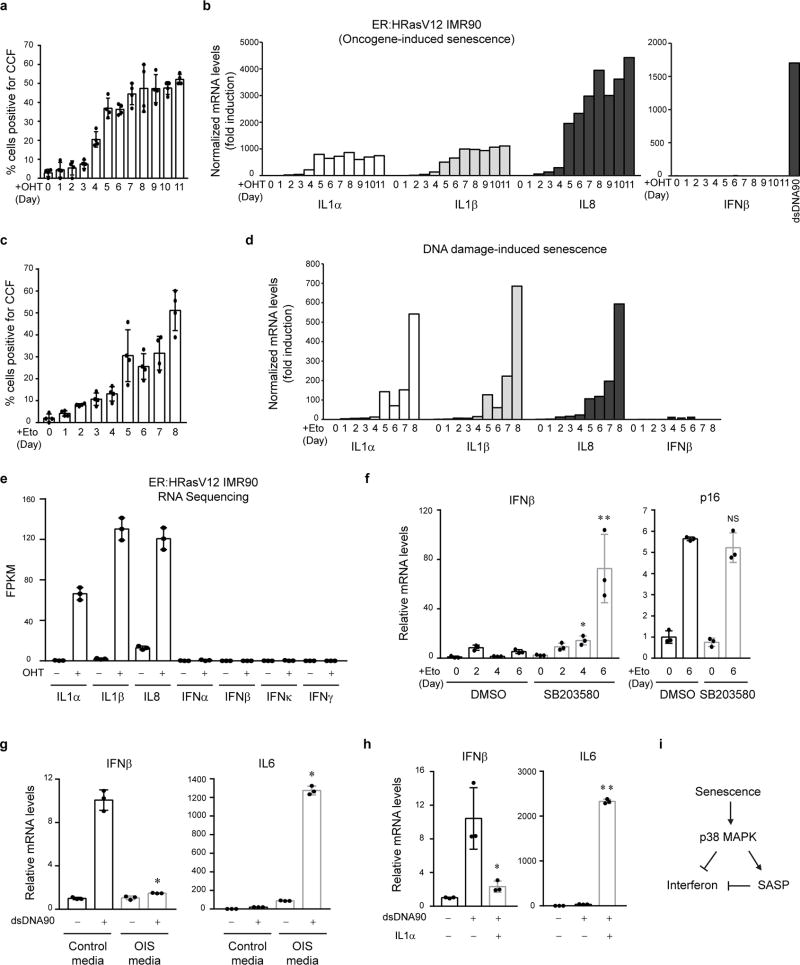
Extended Data Figure 2. Interferon genes are repressed in senescent human fibroblasts.
a–b, ER:HRasV12 IMR90 were induced by OHT and quantified for CCF (a) or analyzed by RT-qPCR (b). c–d, IMR90 were treated with etoposide and analyzed similarly as above. Results shown in b and d were from triplicate technical replicates, and were normalized to the untreated sample. Bar graphs (a and c) show mean values of four different fields with over 200 cells and s.d. e, RNA-seq values of indicated genes. n=3; error bars: s.d. f, IMR90 were treated with a p38 inhibitor. *p<0.005, **p<0.0001, compared to DMSO. g, Cultured media from proliferating or senescent IMR90 were administered to proliferating cells, followed by dsDNA90 transfection. *p<0.0001, compared to control media. h, IMR90 were incubated with recombinant IL1α and transfected with dsDNA90. *p<0.01, **p<0.0001, compared to no-IL1α transfected groups. f–h shows RT-qPCR analyses with mean values and s.d.; n=3; unpaired two-tailed Student’s t-test. i, Schematic illustration of interferon repression in senescence.

