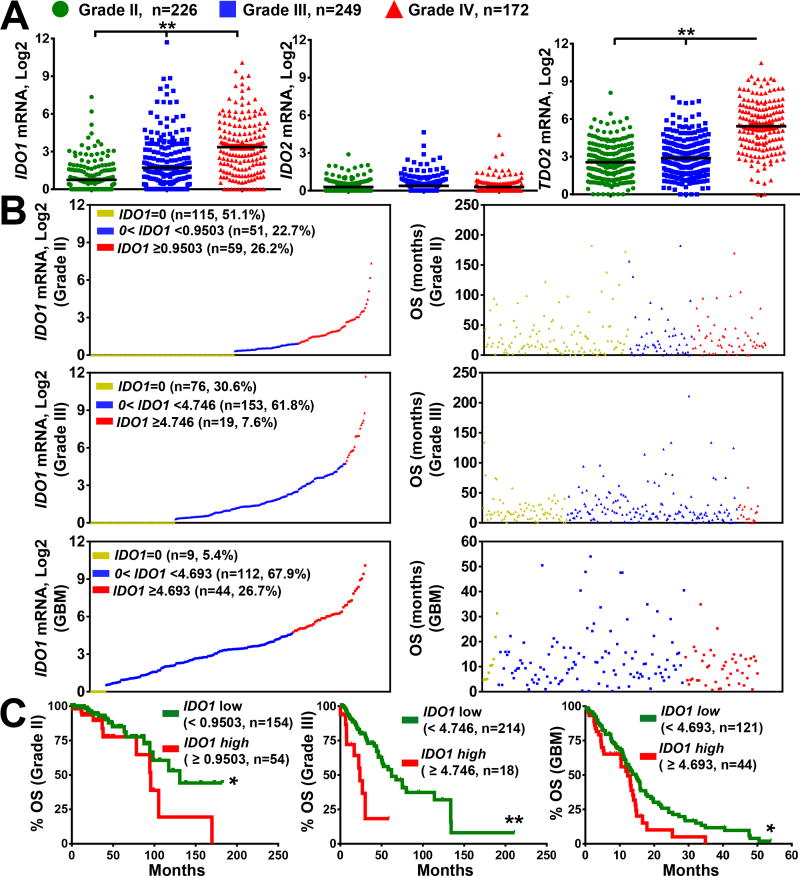
Figure 2. mRNA expression for tryptophan catabolic enzymes in human glioma and the association of IDO1 with overall survival in glioma patients.
(A) The mRNA expression levels for IDO1, IDO2 and TDO2 in grade II (green; n=226) and grade III (blue; n=249) and grade IV (GBM; red; n=172) analyzed from the cancer genome atlas RNA-Hi-Seq. Illumina database. Horizontal lines in the scatter plots represents mean ± SEM. (B) Relative expression of IDO1 mRNA expression (left column) in grade II (top), grade III (middle) and grade IV (bottom) glioma and the corresponding survival (right column). Each dot represents one patient sample that is displayed in 3 colored groups based on IDO1 expression level: undetectable IDO1 mRNA (yellow; IDO1=0); IDO1 mRNA < cutoff (blue) and IDO1 mRNA > cutoff (red). Sample size (n), frequency of the representative population, and cutoff values within each grade of glioma are annotated in the IDO1 mRNA distribution dot plot. (C) Kaplan-Meier (KM) survival analysis of grade II (left), grade III (center) and grade IV (right) glioma patients stratified by IDO1-low (green; below the cutoff) and IDO1-high (red; equal or above the cutoff) expression levels. *, P < 0.05; **, P < 0.01; ***, P < 0.001.

