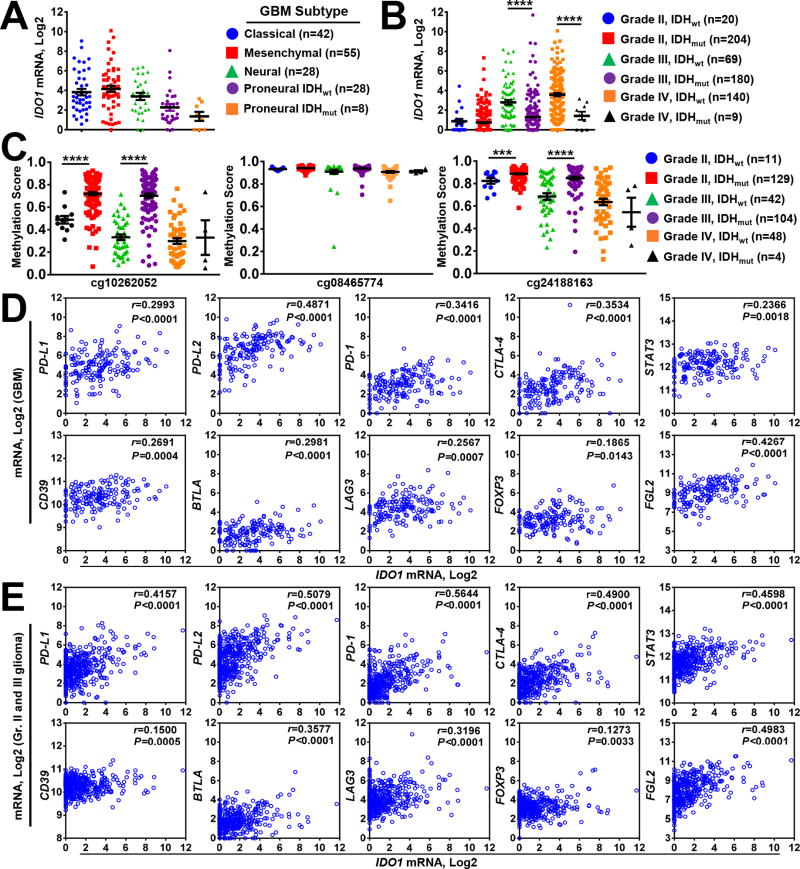
Figure 3. Correlation of GBM IDO1 mRNA levels with IDH mutation, DNA methylation and immunosuppressive gene expression.
(A) IDO1 mRNA levels were compared among classical (blue circle), mesenchymal (red square) and neural (green triangle) GBM subtypes analyzed from the cancer genome atlas RNA-Hi-Seq. Illumina database. The Proneural GBM subtype was further stratified into IDH1/2-wild-type (IDHwt; purple circle) and IDH1/2-mutant (IDHmut; orange square) samples. (B) IDO1 mRNA levels were compared among grade II (IDHwt; blue circle and IDHmut; red square), grade III (IDHwt; green triangle and IDHmut; purple circle), as well as grade IV (IDHwt; orange circle and IDHmut; black triangle) glioma. (C) DNA methylation analysis of cg10262052, cg08465774 and cg24188163 in grade II (IDHwt; blue circle and IDHmut; red square), grade III (IDHwt; green triangle and IDHmut; purple circle), as well as grade IV (IDHwt; orange circle and IDHmut; black triangle) glioma. Pearson’s correlation analysis for IDO1 mRNA with PD-L1, PD-L2, PD-1, CTLA-4, STAT3, CD39, BTLA, LAG3, FOXP3 and FGL2 in (D) GBM and (E) pooled grade II and III glioma. Each small circle in the plot represents a single patient data point. For all the scatter plots, horizontal lines represent mean ± SEM. ***, P < 0.001, ****, P < 0.0001.

