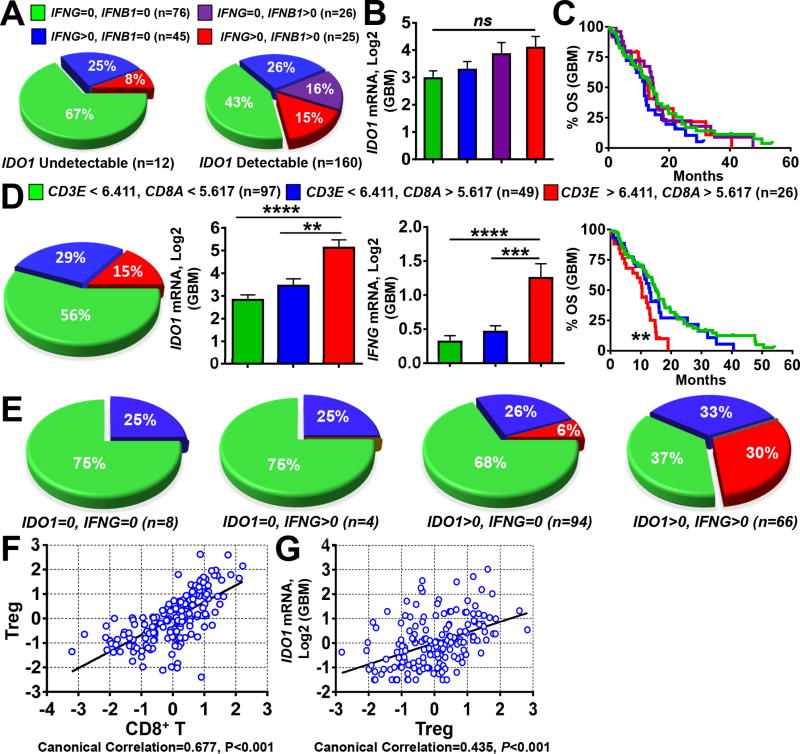
Figure 4. Gene expression correlation analysis between IDO1, IFNG and T cells in human glioblastoma (GBM).
(A) Frequency analysis of GBM specimens with undetectable (left) or detectable (right) IDO1 expression and stratified for the co-absence of IFNG and IFNB1 (green), absence of IFNG and expression of IFNB1 (purple), expression of IFNG and absence of IFNB1 (blue) and co-expression for both IFNG and IFNB1 (red). (B) Comparison of IDO1 mRNA levels among GBM specimens co-absent for IFNG and IFNB1 (green), absent of IFNG and expression of IFNB1 (purple), expression of IFNG and absent of IFNB1 (blue) and co-expression for both IFNG and IFNB1 (red). Sample size (n) of each classification group is same as in (A). (C) KM analysis of GBM patients based on the stratification of IFNG and IFNB1 as performed in (A, B). (D) Classification of 172 GBM specimens based on the expression levels of CD3E and CD8A using the calculated cutoff values (left panel, pie chart) and IDO1 mRNA expression (central panel, bar graph) as well as KM analysis (right panel, survival curves) based on this classification. (E) 172 GBM samples were first classified into 4 groups based on IDO1 and IFNG expression status (undetectable = 0 or detectable > 0), then a frequency analysis was further performed using the same CD3E and CD8A-based stratification as in (A) within each of the four groups. Sample size (n) is the same as in (D). Canonical correlation analysis of (F) CD8+ T cell marker genes, CD3E and CD8A, with those of regulatory T cells (Treg) cells, CD3E, CD4, CD25 and FOXP3, as well as (G) Treg marker genes with IDO1 mRNA expression. Each blue spot represents a GBM patient data point. A regression line was fitted to the dot plot. *: P < 0.05, **: P < 0.01, ***: P < 0.001, ****: P < 0.0001.

