
Extended Data Figure 9. Fine detail scaffold maps of mass cytometry data.
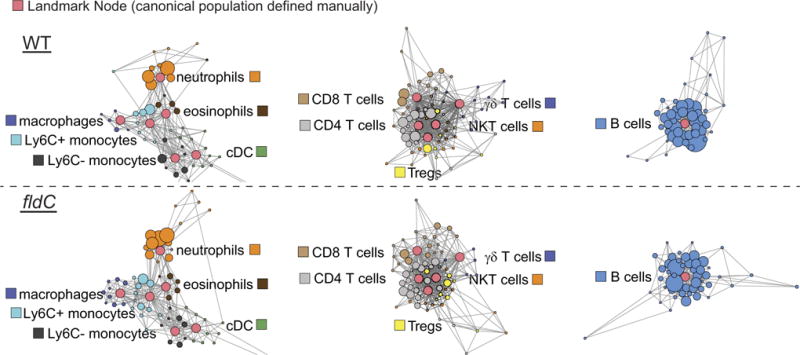
Scaffold maps of mass cytometry data from the peripheral blood of mice colonized with wild-type (top) or fldC mutant (bottom) C. sporogenes. Red nodes represent landmarks, or canonical immune cell populations defined manually. These landmarks facilitate the interpretation of the graph. Other nodes represent unsupervised clusters of similar cells, providing a data-driven representation of the cells present in the samples. The size of these nodes reflects the number of cells in that particular cluster. Unsupervised clusters are coloured according to their nearest landmark node. Edges in the graphs connect similar cells, with the length of each edge inversely proportional to that similarity. Cells that are most similar to one another are thereby connected by a short edge.