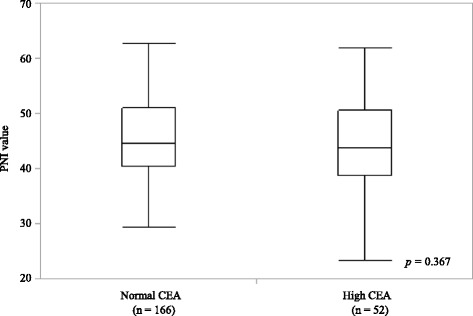
Fig. 2.

PNI values in propensity score matched 218 gastric cancer patients according to the serum level of carcinoembryonic antigen. Kruskal-Wallis test: p = 0.367. In each box plot, the lower and upper ends of the box represent the 25th and 75th percentiles, respectively. Capped bars indicate the minimum and maximum values, respectively, and the line inside the box represents the median PNI value
