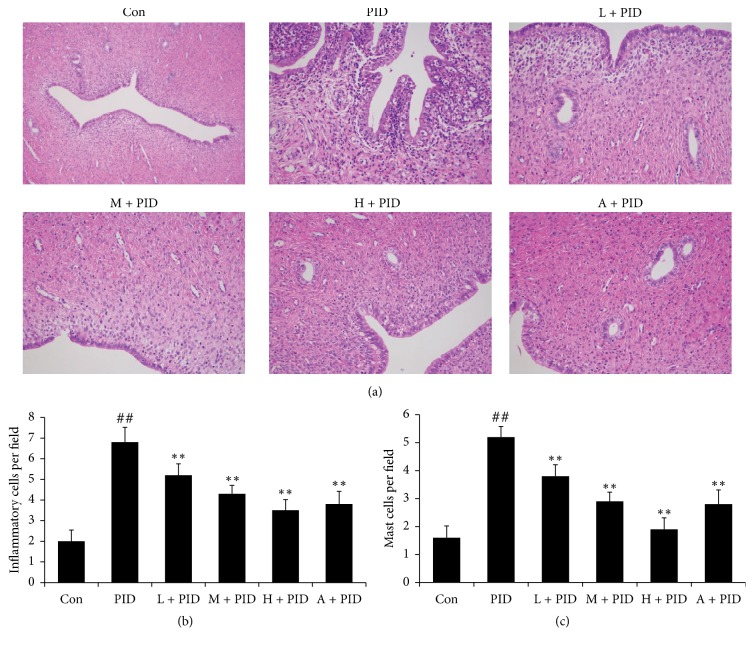
Figure 2.
Effect of FYCWYC on infiltration of neutrophils and lymphocytes in uterus and fallopian tube after pathogenic infection. (a) Representative micrographs of uterus and fallopian. (b) Inflammatory cells numbers in the observed fields. (c) Mast cells numbers in the observed fields. Data were presented as the means ± standard error (n = 8). ##P < 0.01 versus control group, ∗∗P < 0.01 versus PID group.

