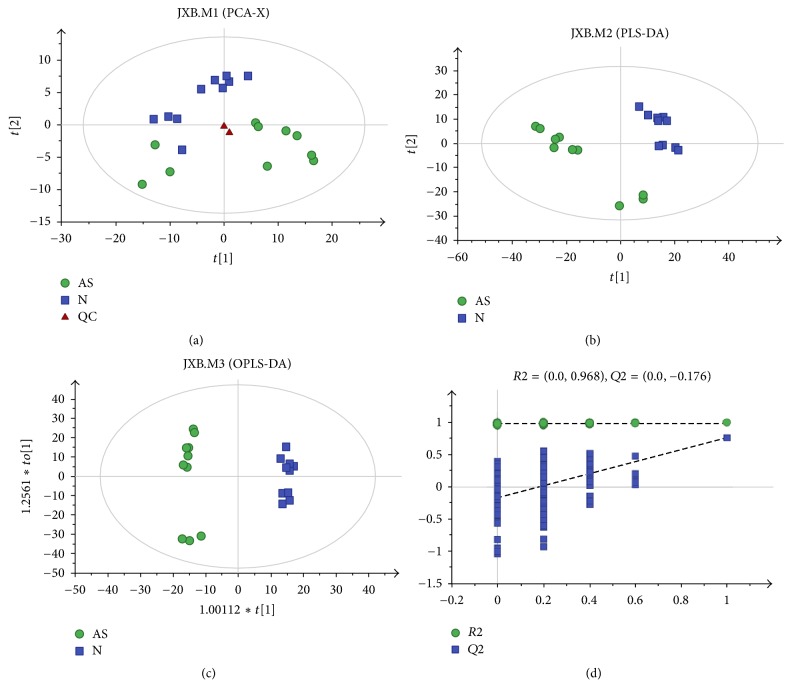
Figure 2.
Multivariate statistical analysis for GC-MS based on metabolic profiling of sperm cells from the merged samples of the healthy controls and patients with idiopathic asthenozoospermia. (a) A PCA score plot data from healthy controls (blue) versus idiopathic asthenozoospermia patients (green), (b) a PLS-DA scores plot data from healthy controls (blue) versus idiopathic asthenozoospermia patients (green), (c) a OPLS-DA scores plot data from healthy controls (blue) versus idiopathic asthenozoospermia patients (green), and (d) internal cross-validation plot with a permutation test repeated 200 times.

