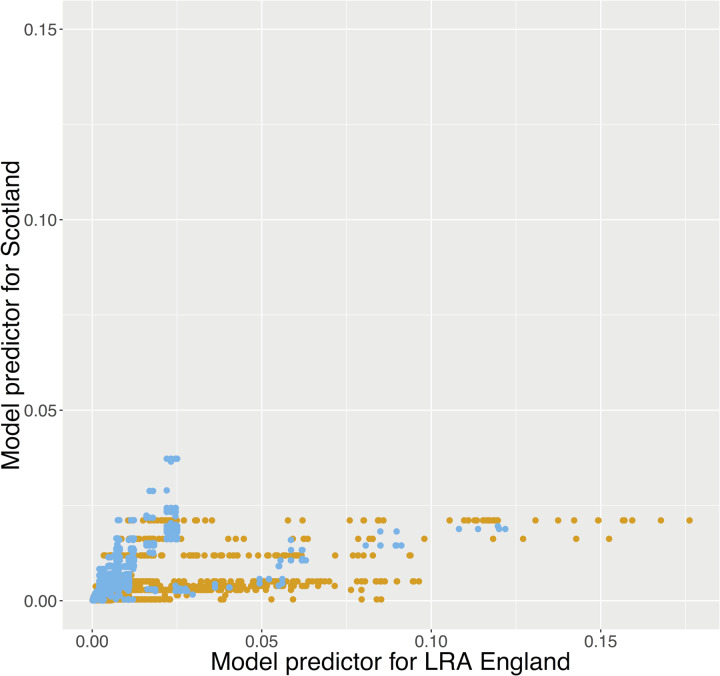
Fig. 4.
Herd probability of infection given by the English (LRA) and Scottish predictors. The different colours represent the location of each herd (orange: LRA England, light blue: Scotland). If herds in Scotland were exposed to the same level of risk as herds in LRA England, their probability of getting infected would be higher. From the other hand, if herds in LRA England were exposed to the same level of risk as herds in Scotland, their probability of getting infected would be lower.

