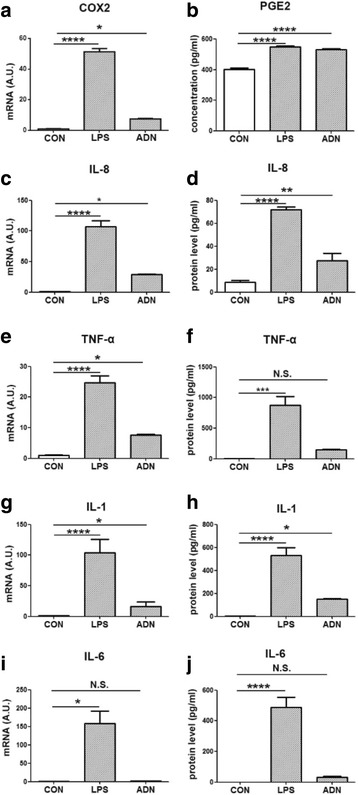
Fig. 5.

The expression of inflammatory markers in macrophages. THP-1 cells were treated with1 μg/mL lipopolysaccharides (LPS) or 5 μg/mL full length adiponectin (ADN) for 18 h. a the relative mRNA expression of cox2. b the PGE2 secretion to the culture medium. c the relative mRNA expression of IL-8. d the IL-8 secretion to the culture medium. e the relative mRNA expression of TNF-α. f the TNF-α secretion to the culture medium. g the relative mRNA expression of IL-1. h the IL-1 secretion to the culture medium. i the relative mRNA expression of IL-6. j the IL-6 secretion to the culture medium. Data were analyzed by one-way ANOVA with mean separation using Tukey’s test. Each bar represents the mean ± SEM; a value of p ≤ 0.05 was considered significant. * means p ≤ 0.05, ** means p ≤ 0.005, *** means p ≤ 0.0005, **** means p ≤ 0.0001
