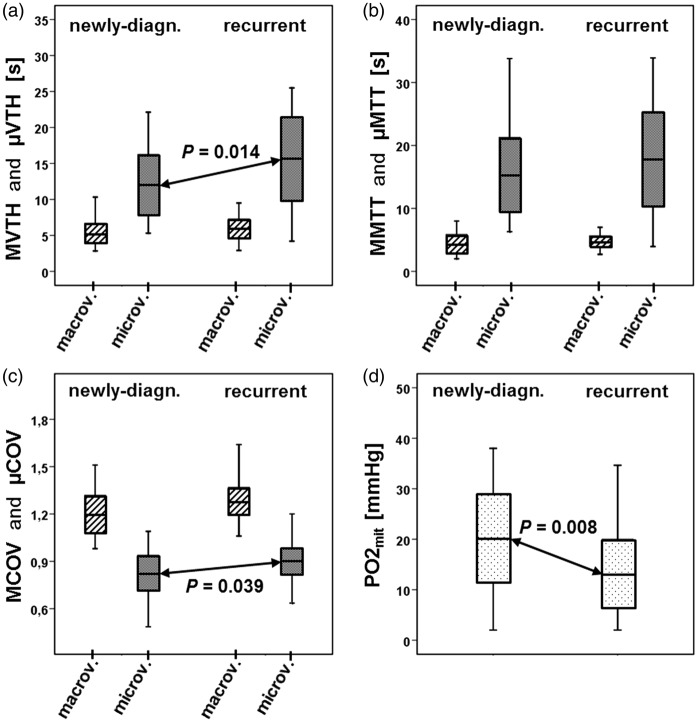
Figure 2.
Box-whisker plots (whiskers: minimum, maximum; box: 25th to 75th percentile; line: mean value) VTH mapping parameters and the PO2mit values of all patients with newly-diagnosed glioblastoma (N = 25) and recurrent glioblastoma (N = 32). (a) macrovascular and microvascular VTH (MVTH and µVTH) within newly-diagnosed (left part) and recurrent glioblastoma (right part). µVTH was significant higher (P = 0.014) in recurrent glioblastoma compared to newly-diagnosed glioblastoma. (b) macrovascular and microvascular MTT (MMTT and µMTT) within newly-diagnosed (left part) and recurrent glioblastoma (right part). MMTT was increased in recurrent glioblastoma but reached not statistical significance. (c) macrovascular and microvascular COV (MCOV and µCOV) within newly-diagnosed (left part) and recurrent glioblastoma (right part). µCOV was significant higher (P = 0.039) in recurrent glioblastoma compared to newly-diagnosed glioblastoma. (d) oxygen tension in tissue surrounding mitochondria (PO2mit) within newly-diagnosed (left part) and recurrent glioblastoma (right part). PO2mit was significant lower (P = 0.008) in recurrent glioblastoma compared to newly-diagnosed glioblastoma. Macrov: macrovasculature; microv: microvasculature.

