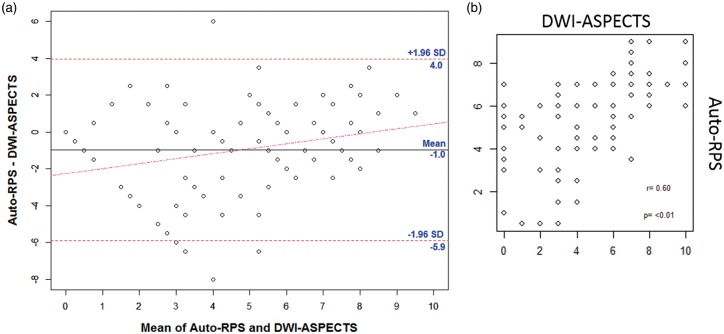
Figure 3.
Bland–Altman plot (a) of post treatment auto-RPS and DWI-ASPECTS. The mean difference between the two modalities was −0.7 indicating that slightly more abnormal perfusion regions is observed on auto-RPS relative to regions of ischemic injury observed using DWI. The horizontal lines represent the mean difference in scores and ±1.96 SD. The red dashed line represents the regression line of differences. Correlation plot (b) showing positive correlation of Auto-RPS with DWI-ASPECTS, ρ = 0.6, p < 0.01.

