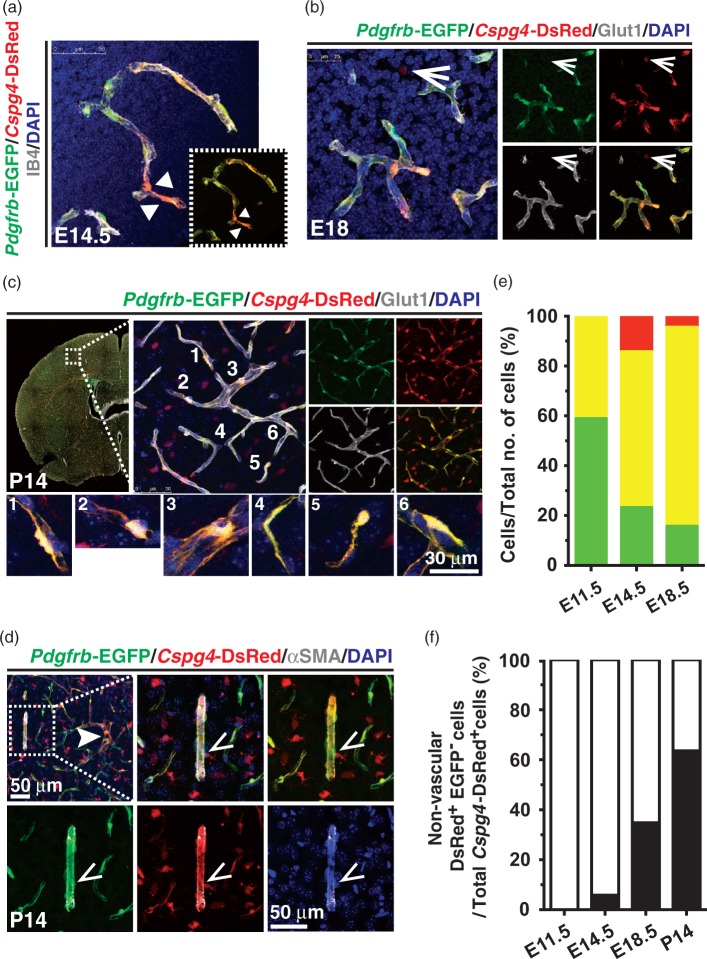
Figure 4.
Heterogeneity of vascular mural cells in developing mouse brain cortex. (a–d) Frontal brain cortex from Pdgfrb-EGFP; Cspg4-DsRed mice was examined at E14.5 (a), E18 (b) and P14 (c and d). The CNS microvasculature was visualized by either IB4 (a) or Glut1 (b and c) immunostaining over DAPI. Dotted box in (a) shows Pdgfrb-EGFP+ and Cspg4-DsRed+ signals only. Various shapes of mural cells in vicinity to the CNS microvessels at P14 are shown (c, 1–6). (d) Arteriole was depicted by αSMA staining (dotted box, d). Perivascular Cspg4-DsRedhi Pdgfrb-EGFPlo mural cells (arrowheads, a), a non-vascular Cspg4-DsRed+ Pdgfrb-EGFP− cell (open arrows, b) and a perivascular Cspg4-DsRed+ Pdgfrb-EGFP− cell (open arrowheads, d) are indicated. (e) Quantification of perivascular Pdgfrb-EGFP+ / Cspg4-DsRed− (green), Cspg4-DsRed+ /Pdgfrb-EGFP- (red) and Pdgfrb-EGFP+ / Cspg4-DsRed+ (yellow) cells over total cell number counted per field. (f) Quantification of parenchymal Cspg4-DsRed+ /Pdgfrb-EGFP- cells over total Cspg4-DsRed+ cells. (n ≥ 3 per each time point except P14 (N = 2), one-way ANOVA).

