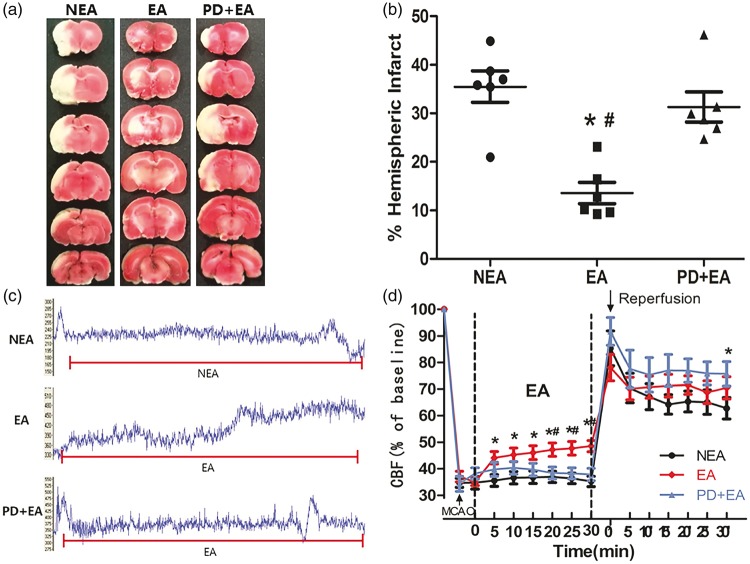
Figure 3.
Effect of electroacupuncture on infarct volume and cerebral perfusion. (a) Representative TTC staining in comparable sections from the three groups. (b) Quantification of the ratio of hemispheric infarct (n = 6/group). (c) Representative trace recordings of the blood perfusion during EA in the three groups. (d) Quantification of rCBF compared with baseline (n = 10/group). Data are presented as the mean ± SEM. *P < 0.05 vs. NEA group, #P < 0.05 vs. PD + EA group.

