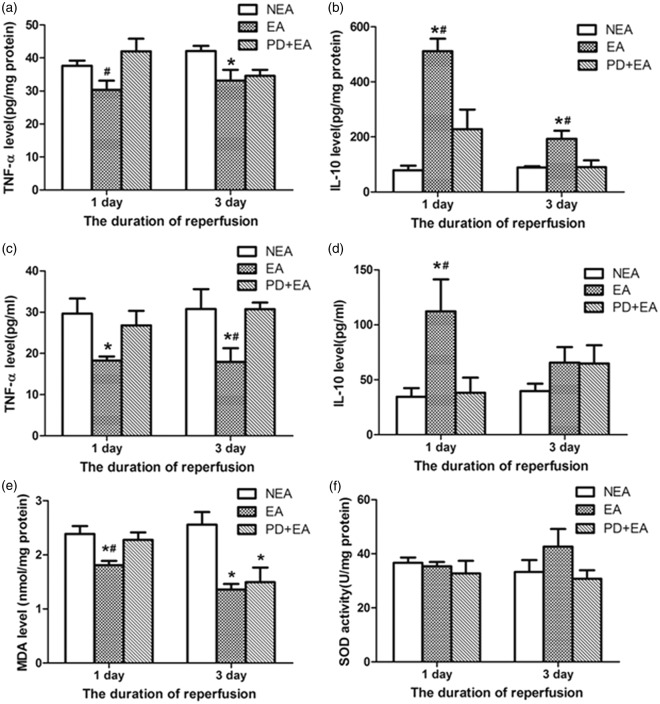
Figure 4.
Effect of electroacupuncture on inflammation and oxidative stress. (a) TNF-α level in the peri-infarct area. (b) IL-10 level in the peri-infarct area. (c) Serum TNF-α level. (d) Serum IL-10 level. (e) MDA level. (f) SOD activity. Data are presented as the mean ± SEM (n = 6 per group on day 1, n = 4 per group on day 3). *P < 0.05 vs. NEA group, #P < 0.05 vs. PD + EA group.

