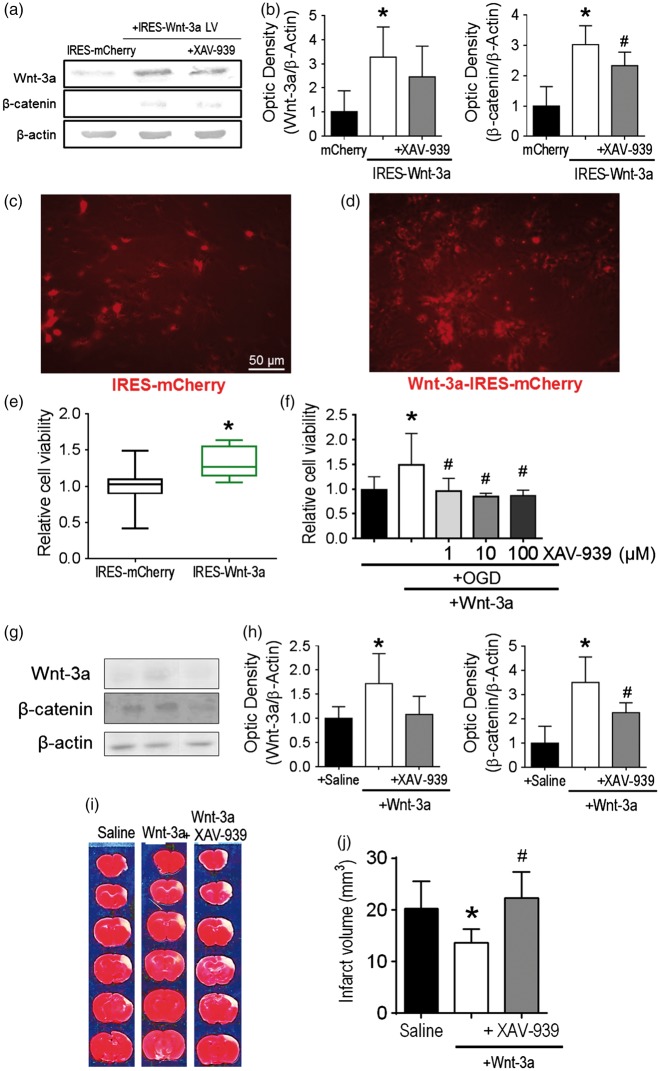
Figure 1.
Wnt-3a treatment was neuroprotective after stroke. (a) Representative Western blots of cell lysates following infection with IRES-mCherry control vector or IRES-Wnt-3a-mCherry vector with or without XAV-939 cotreatment. (b) Quantification of Western blot analyses for Wnt-3a and β-catenin. (c) and (d) Representative images of in vitro primary cortical neurons subjected to 16-h reperfusion following 3-h OGD treatment among different groups. The cell density is higher in (d) due to the Wnt-3a protective effect against OGD. Cell density before OGD was similar between the two groups (data not shown). (e) Quantification of cell viability via MTT assay (24 h after OGD) demonstrated increased neuronal cell viability with Wnt-3a overexpression. Viability data are presented as box and whisker plot (min to max). All data are represented as mean ± SD; *p < 0.05 compared to mCherry; #p < 0.05 compared to IRES-Wnt-3a. (f) Application of recombinant Wnt-3a into media resulted in greater neuronal cell viability following OGD and reperfusion, and inhibition of Wnt signaling with XAV-939 reversed the neuroprotective effects. All data are represented as mean ± SD; *p < 0.05 compared to OGD; #p < 0.05 compared to OGD + Wnt-3a. (g) and (i) Confirmation for in vivo dosages of intranasal Wnt-3a and XAV-939 administration at 3d after stroke. (g) Representative Western blots for peri-infarct tissue lysates. (h) Quantification of protein levels of Wnt-3a and β-catenin. N = 4 for saline and Wnt3 + XAV-939 groups, and 5 for Wnt-3a group. (i) and (j) Representative TTC staining images and quantification of infarct volume at 72 h after stroke. TTC data are represented as mean ± SD; *p < 0.05 compared to saline; #p < 0.05 compared to Wnt-3a. N = 12 for saline group, 16 for Wnt-3a group, and 16 for Wnt-3a + XAV-939 group.

