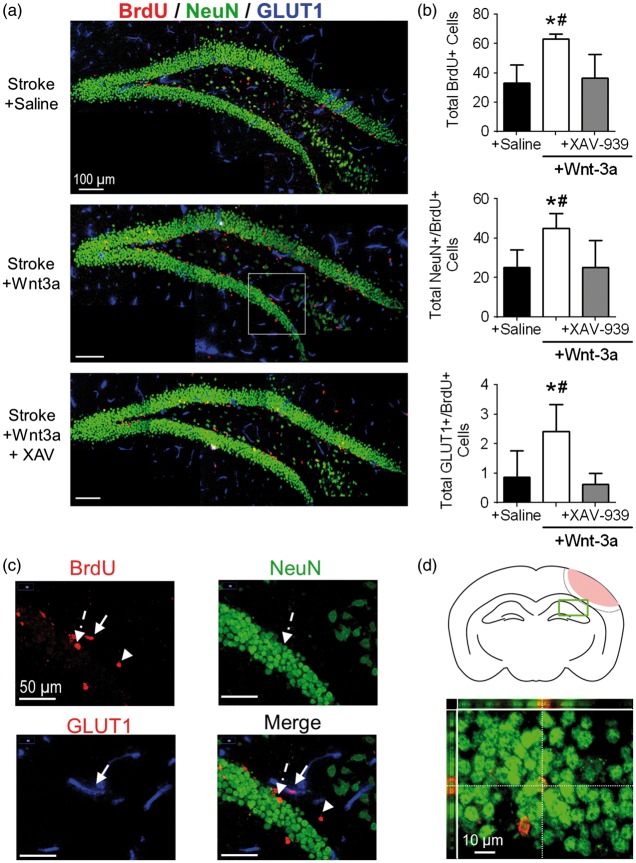
Figure 5.
Wnt-3a activation promotes hippocampal neurogenesis in the SGZ after cortical stroke. (a) Representative immunofluorescence images for NeuN+ (green), BrdU+ (red), and GLUT1 (blue). (b) Quantification of neurogenesis by NeuN+/BrdU+ co-labeled cells and angiogenesis by GLUT1+/BrdU+ co-labeled cells in the SGZ following stroke induction and administration of either saline (negative control), Wnt-3a, or Wnt-3a+XAV-939. N = 7 for all groups. (c) 40x images demonstrating BrdU + non-colocalized cell (arrowhead), colocalization of NeuN and BrdU (dashed arrow), and colocalization of GLUT1 + and BrdU (solid arrow). (d) Top panel: cartoon of the coronal section depicting the SGZ region of interest (green box) that was acquired and quantified. Bottom panel: representative high magnification (60×) confocal image to confirm colocalization of BrdU and NeuN. All data represented as mean ± SD; *p < 0.05 compared to saline; #p < 0.05 compared to Wnt-3a + XAV-939. N = 5 for saline and Wnt-3a groups, and 4 for Wnt-3a + XAV-939 group.

