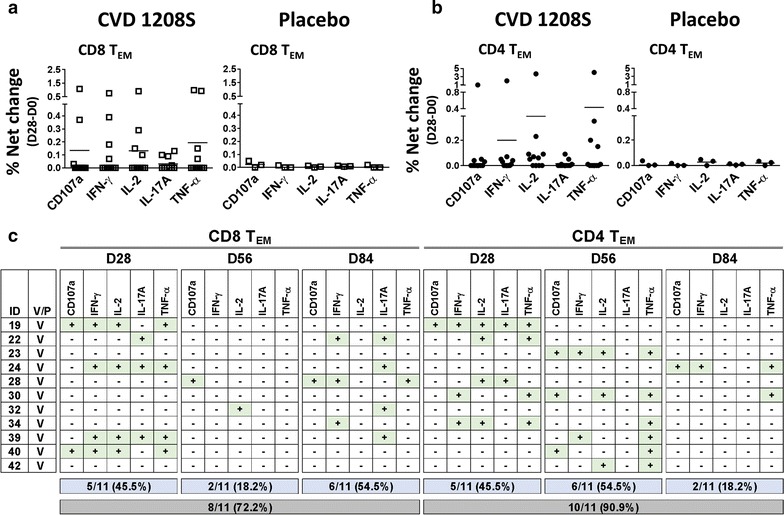
Fig. 3.

CD107a upregulation or cytokine production by TEM cells after CVD 1208S immunizations. a Displays CD107a upregulation [% net change (day 28-day0)] (degranulation marker) or cytokine production by CD8 TEM cells in CVD 1208S (left panel) and placebo (right panel) recipients 28 days after the first immunization. In b similar data is presented for CD4 TEM cells. c A summary of CD107a expression or cytokine production 28 days after each immunization (days 28, 56 and 84) in each vaccinated individual. The data is shown for CD8 and CD4 TEM cells. Volunteers who upregulated CD107a or exhibited increases in particular cytokines are indicated with a + sign in a green box (data derived from % net changes relative to day 0). Indicated in the blue boxes are the number (and percentage) of vaccinated volunteers that exhibited increases in at least one cytokine or upregulated CD107a after each immunization. The gray boxes show the number and corresponding percentage (%) of vaccinated volunteers that exhibited increases in at least one cytokine or upregulated CD107a after receiving the three vaccine doses
