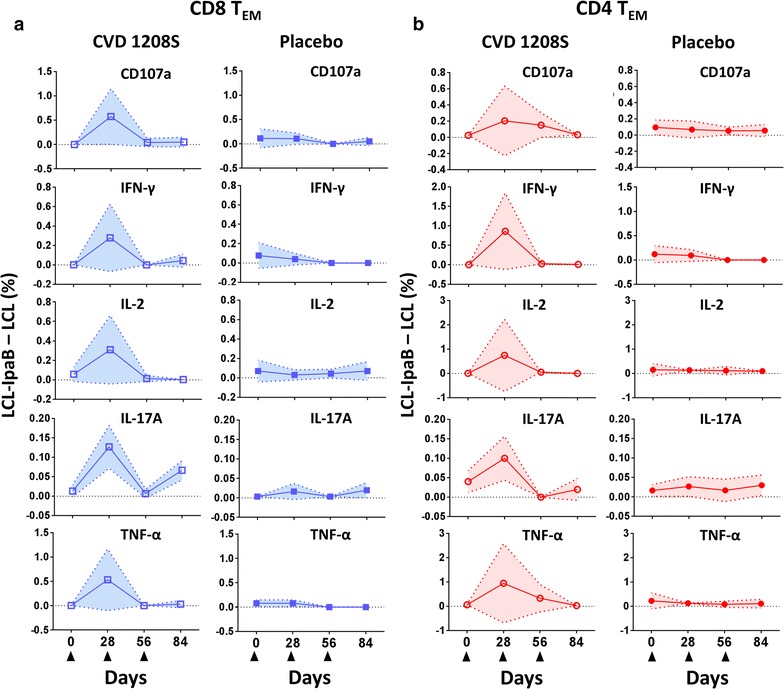
Fig. 4.

Kinetics of cytokine production or CD107a expression in TEM cells. a Kinetics of CD107a expression (degranulation marker) or cytokine production by CVD1208S (left panels) and placebo (right panels) recipients in CD8 TEM cells. Filled triangles at the bottom indicate vaccination days. In the vaccinated group only the data of the individuals that showed increase in CD107a or cytokine expression relative to pre-vaccination (Fig. 3c) were used to generate these graphs. In the placebo group all the available data was used. The data is presented as the difference between the percentage of B-LCL cells loaded with IpaB and unstimulated B-LCL cells [LCL-IpaB − LCL (%)]. b Similar data from CD4 TEM cells. Arithmetic mean ± SD are displayed in the plots
