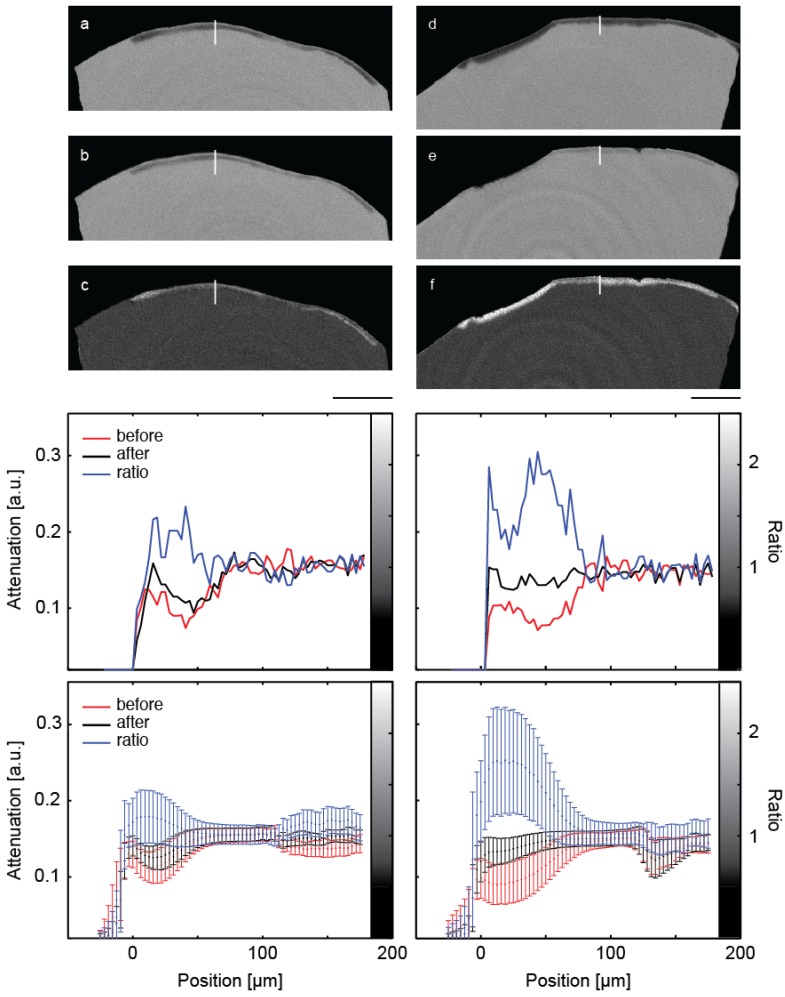
Figure 2.
The images show selected slices of the μCT-data from the two pieces of the crown through the induced lesions. The images (a) and (d) are obtained before treatment. The related slices of the μCT-data after the treatment are images (b) and (e), (b) being the control and (e) the specimen treated with the peptide. Images (c) and (f) show the ratio of the attenuation values. The length bar corresponds to 500 μm. The diagrams in the central row show selected line plots through the lesion with locations indicated by the white lines in the images above. The increased mineral content caused by the mineralization treatments is clearly indicated. In the diagrams in the bottom row, the attenuation in the lesions is plotted against the distance from the specimen surface, integrated over the entire specimen. Error bars correspond to the standard deviation.

