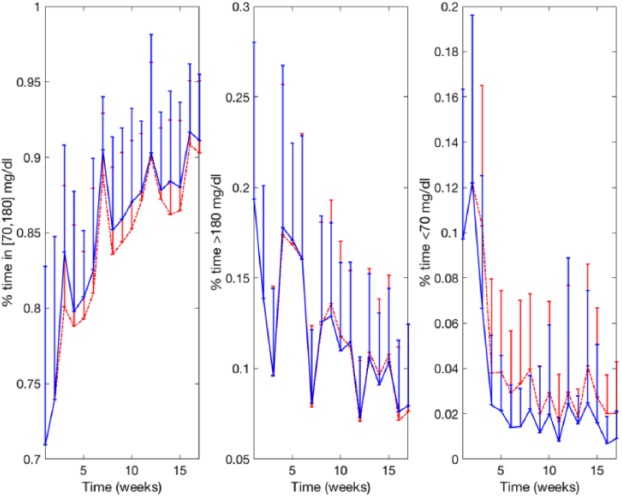
Figure 7.
Weekly evolution of the average percentage time in target (% in T), percentage time below target (% < T), and percentage time above target (% > T) corresponding to the adult cohort corresponding the original R2R controller (dashed red line) and the new R2R controller (solid blue line). Error bars represent the standard deviation.

